Peak Reaction Zones [BigBeluga]Peak Reaction Zones is an advanced Smart Money Concept (SMC) indicator that identifies the most recent swing high and swing low zones, helping traders determine premium and discount areas for optimal trade positioning.
🔵 Key Features:
Swing High & Low Zones:
Automatically detects the latest swing high and swing low levels.
Helps traders identify key reaction points where price is likely to respond.
Premium & Discount Concept:
The high zone represents a premium area, where price is overextended and may reverse.
The low zone represents a discount area, where price is undervalued and may bounce.
The midline dynamically marks the equilibrium of the range.
Adjustable Zone Width:
Users can fine-tune the width of the zones to match their trading style.
Wider zones capture broader reaction ranges, while narrower zones focus on precise levels.
Zone Retest Signals:
Blue markers appear when price retests the lower reaction zone, signaling potential support.
Orange markers appear when price retests the upper reaction zone, indicating possible resistance.
Price Labels for Key Levels:
Displays the price value of the swing high, swing low, and midline for quick reference.
Helps traders recognize major reaction points at a glance.
🔵 Usage:
Smart Money Trading: Utilize the premium and discount concept to align trades with institutional order flow.
Zone Reactions: Watch for price tests of reaction zones and use the retest signals to confirm potential reversals.
Midline Confirmation: If price holds above or below the midline, it can indicate directional bias.
Scalping & Swing Trading: Short-term traders can look for zone rejections, while swing traders can use the levels for trend continuation setups.
Peak Reaction Zones is a must-have tool for traders looking to trade with Smart Money Concepts, allowing for precise entries and exits based on key liquidity areas and market structure.
Indicators and strategies

[COG]StochRSI Zenith📊 StochRSI Zenith
This indicator combines the traditional Stochastic RSI with enhanced visualization features and multi-timeframe analysis capabilities. It's designed to provide traders with a comprehensive view of market conditions through various technical components.
🔑 Key Features:
• Advanced StochRSI Implementation
- Customizable RSI and Stochastic calculation periods
- Multiple moving average type options (SMA, EMA, SMMA, LWMA)
- Adjustable signal line parameters
• Visual Enhancement System
- Dynamic wave effect visualization
- Energy field display for momentum visualization
- Customizable color schemes for bullish and bearish signals
- Adaptive transparency settings
• Multi-Timeframe Analysis
- Higher timeframe confirmation
- Synchronized market structure analysis
- Cross-timeframe signal validation
• Divergence Detection
- Automated bullish and bearish divergence identification
- Customizable lookback period
- Clear visual signals for confirmed divergences
• Signal Generation Framework
- Price action confirmation
- SMA-based trend filtering
- Multiple confirmation levels for reduced noise
- Clear entry signals with customizable display options
📈 Technical Components:
1. Core Oscillator
- Base calculation: 13-period RSI (adjustable)
- Stochastic calculation: 8-period (adjustable)
- Signal lines: 5,3 smoothing (adjustable)
2. Visual Systems
- Wave effect with three layers of visualization
- Energy field display with dynamic intensity
- Reference bands at 20/30/50/70/80 levels
3. Confirmation Mechanisms
- SMA trend filter
- Higher timeframe alignment
- Price action validation
- Divergence confirmation
⚙️ Customization Options:
• Visual Parameters
- Wave effect intensity and speed
- Energy field sensitivity
- Color schemes for bullish/bearish signals
- Signal display preferences
• Technical Parameters
- All core calculation periods
- Moving average types
- Divergence detection settings
- Signal confirmation criteria
• Display Settings
- Chart and indicator signal placement
- SMA line visualization
- Background highlighting options
- Label positioning and size
🔍 Technical Implementation:
The indicator combines several advanced techniques to generate signals. Here are key components with code examples:
1. Core StochRSI Calculation:
// Base RSI calculation
rsi = ta.rsi(close, rsi_length)
// StochRSI transformation
stochRSI = ((ta.highest(rsi, stoch_length) - ta.lowest(rsi, stoch_length)) != 0) ?
(100 * (rsi - ta.lowest(rsi, stoch_length))) /
(ta.highest(rsi, stoch_length) - ta.lowest(rsi, stoch_length)) : 0
2. Signal Generation System:
// Core signal conditions
crossover_buy = crossOver(sk, sd, cross_threshold)
valid_buy_zone = sk < 30 and sd < 30
price_within_sma_bands = close <= sma_high and close >= sma_low
// Enhanced signal generation
if crossover_buy and valid_buy_zone and price_within_sma_bands and htf_allows_long
if is_bullish_candle
long_signal := true
else
awaiting_bull_confirmation := true
3. Multi-Timeframe Analysis:
= request.security(syminfo.tickerid, mtf_period,
)
The HTF filter looks at a higher timeframe (default: 4H) to confirm the trend
It only allows:
Long trades when the higher timeframe is bullish
Short trades when the higher timeframe is bearish
📈 Trading Application Guide:
1. Signal Identification
• Oversold Opportunities (< 30 level)
- Look for bullish crosses of K-line above D-line
- Confirm with higher timeframe alignment
- Wait for price action confirmation (bullish candle)
• Overbought Conditions (> 70 level)
- Watch for bearish crosses of K-line below D-line
- Verify higher timeframe condition
- Confirm with bearish price action
2. Divergence Trading
• Bullish Divergence
- Price makes lower lows while indicator makes higher lows
- Most effective when occurring in oversold territory
- Use with support levels for entry timing
• Bearish Divergence
- Price makes higher highs while indicator shows lower highs
- Most reliable in overbought conditions
- Combine with resistance levels
3. Wave Effect Analysis
• Strong Waves
- Multiple wave lines moving in same direction indicate momentum
- Wider wave spread suggests increased volatility
- Use for trend strength confirmation
• Energy Field
- Higher intensity in trading zones suggests stronger moves
- Use for momentum confirmation
- Watch for energy field convergence with price action
The energy field is like a heat map that shows momentum strength
It gets stronger (more visible) when:
Price is in oversold (<30) or overbought (>70) zones
The indicator lines are moving apart quickly
A strong signal is forming
Think of it as a "strength meter" - the more visible the energy field, the stronger the potential move
4. Risk Management Integration
• Entry Confirmation
- Wait for all signal components to align
- Use higher timeframe for trend direction
- Confirm with price action and SMA positions
• Stop Loss Placement
- Consider placing stops beyond recent swing points
- Use ATR for dynamic stop calculation
- Account for market volatility
5. Position Management
• Partial Profit Taking
- Consider scaling out at overbought/oversold levels
- Use wave effect intensity for exit timing
- Monitor energy field for momentum shifts
• Trade Duration
- Short-term: Use primary signals in trading zones
- Swing trades: Focus on divergence signals
- Position trades: Utilize higher timeframe signals
⚠️ Important Usage Notes:
• Avoid:
- Trading against strong trends
- Relying solely on single signals
- Ignoring higher timeframe context
- Over-leveraging based on signals
Remember: This tool is designed to assist in analysis but should never be used as the sole decision-maker for trades. Always maintain proper risk management and combine with other forms of analysis.

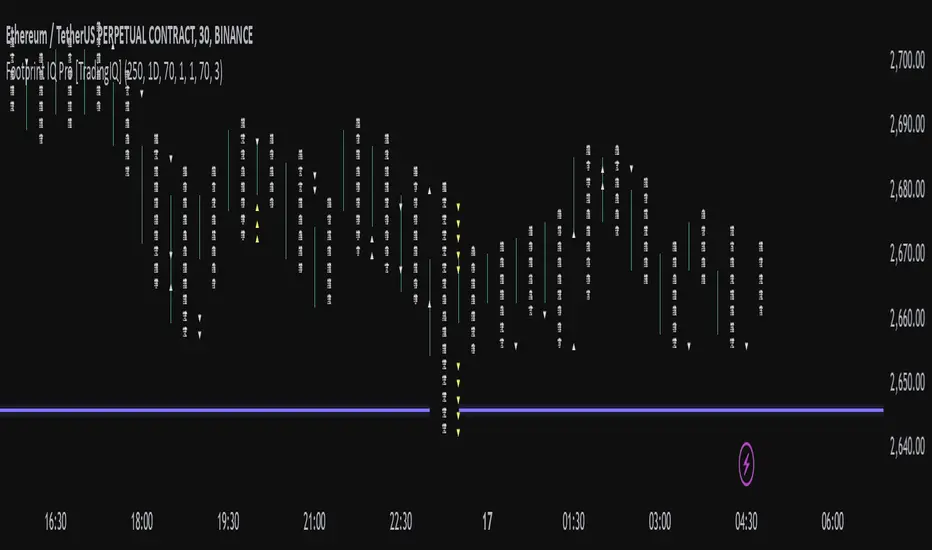
Footprint IQ Pro [TradingIQ]Hello Traders!
Introducing "Footprint IQ Pro"!
Footprint IQ Pro is an all-in-one Footprint indicator with several unique features.
Features
Calculated delta at tick level
Calculated delta ratio at tick level
Calculated buy volume at tick level
Calculated sell volume at tick level
Imbalance detection
Stacked imbalance detection
Stacked imbalance alerts
Value area and POC detection
Highest +net delta levels detection
Lowest -net delta levels detection
CVD by tick levels
Customizable values area percentage
The image above thoroughly outlines what each metric in the delta boxes shows!
Metrics In Delta Boxes
"δ:", " δ%:", " ⧎: ", " ◭: ", " ⧩: "
δ Delta (Difference between buy and sell volume)
δ% Delta Ratio (Delta as a percentage of total volume)
⧎ Total Volume At Level (Total volume at the price area)
◭ Total Buy Volume At Level (Total buy volume at the price area)
⧩ Total Sell Volume At Level (total sell volume at the price area)
Each metric comes with a corresponding symbol.
That said, until you become comfortable with the symbol, you can also turn on the descriptive labels setting!
The image above exemplifies the feature.
The image above shows Footprint IQ's full power!
Additionally, traders with an upgraded TradingView plan can make use of the "1-Second" feature Footprint IQ offers!
The image above shows each footprint generated using 1-second volume data. 1-second data is highly granular compared to 1-minute data and, consequently, each footprint is exceptionally more accurate!
Imbalance Detection
Footprint IQ pro is capable of detecting user-defined delta imbalances.
The image above further explains how Footprint IQ detects imbalances!
The imbalance percentage is customizable in the settings, and is set to 70% by default.
Therefore,
When net delta is positive, and the positive net delta constitutes >=70% of the total volume, a buying imbalance will be detected (upwards triangle).
When net delta is negative, and the negative net delta constitutes >=70% of the total volume, a buying imbalance will be detected (downwards triangle).
Stacked Imbalance Detection
In addition to imbalance detection, Footprint IQ Pro can also detect stacked imbalances!
The image above shows Footprint IQ Pro detecting stacked imbalances!
Stacked imbalances occur when consecutive imbalances at sequential price areas occur. Stacked imbalances are generally interpreted as significant price moves that are supported by volume, rather than a significant result with disproportionate effort.
The criteria for stacked imbalance detection (how many imbalances must occur at sequential price areas) is customizable in the settings.
The default value is three. Therefore, when three imbalances occur at sequential price areas, golden triangles will begin to print to show a stacked imbalance.
Additionally, traders can set alerts for when stacked imbalances occur!
Highest +Delta and Highest -Delta Levels
In addition to being a fully-fledged Footprint indicator, Footprint IQ Pro goes one step further by detecting price areas where the greater +Delta and -Delta are!
The image above shows price behavior near highest +Delta price areas detected by Footprint IQ!
These +Delta levels are considered important as there has been strong interest from buyers at these price areas when they are traded at.
It's expected that these levels can function as support points that are supported by volume.
The image above shows a similar function for resistance points!
Blue lines = High +Delta Detected Price Areas
Red lines = High -Delta Detected Price Areas
Value Area Detection
Similar to traditional volume profile, Footprint IQ Pro displays the value area per bar.
Green lines next to each footprint show the value area for the bar. The value area % is customizable in the settings.
CVD Levels
Footprint IQ Pro is capable of storing historical volume delta information to provide CVD measurements at each price area!
The image above exemplifies this feature!
When this feature is enabled, you will see the CVD of each price area, rather than the net delta!
And that's it!
Thank you so much to TradingView for offering the greatest charting platform for everyone to create on!
If you have any feature requests you'd like to see for Footprint IQ, please feel free to share them with us!
Thank you!
TASC 2025.03 A New Solution, Removing Moving Average Lag█ OVERVIEW
This script implements a novel technique for removing lag from a moving average, as introduced by John Ehlers in the "A New Solution, Removing Moving Average Lag" article featured in the March 2025 edition of TASC's Traders' Tips .
█ CONCEPTS
In his article, Ehlers explains that the average price in a time series represents a statistical estimate for a block of price values, where the estimate is positioned at the block's center on the time axis. In the case of a simple moving average (SMA), the calculation moves the analyzed block along the time axis and computes an average after each new sample. Because the average's position is at the center of each block, the SMA inherently lags behind price changes by half the data length.
As a solution to removing moving average lag, Ehlers proposes a new projected moving average (PMA) . The PMA smooths price data while maintaining responsiveness by calculating a projection of the average using the data's linear regression slope.
The slope of linear regression on a block of financial time series data can be expressed as the covariance between prices and sample points divided by the variance of the sample points. Ehlers derives the PMA by adding this slope across half the data length to the SMA, creating a first-order prediction that substantially reduces lag:
PMA = SMA + Slope * Length / 2
In addition, the article includes methods for calculating predictions of the PMA and the slope based on second-order and fourth-order differences. The formulas for these predictions are as follows:
PredictPMA = PMA + 0.5 * (Slope - Slope ) * Length
PredictSlope = 1.5 * Slope - 0.5 * Slope
Ehlers suggests that crossings between the predictions and the original values can help traders identify timely buy and sell signals.
█ USAGE
This indicator displays the SMA, PMA, and PMA prediction for a specified series in the main chart pane, and it shows the linear regression slope and prediction in a separate pane. Analyzing the difference between the PMA and SMA can help to identify trends. The differences between PMA or slope and its corresponding prediction can indicate turning points and potential trade opportunities.
The SMA plot uses the chart's foreground color, and the PMA and slope plots are blue by default. The plots of the predictions have a green or red hue to signify direction. Additionally, the indicator fills the space between the SMA and PMA with a green or red color gradient based on their differences:
Users can customize the source series, data length, and plot colors via the inputs in the "Settings/Inputs" tab.
█ NOTES FOR Pine Script® CODERS
The article's code implementation uses a loop to calculate all necessary sums for the slope and SMA calculations. Ported into Pine, the implementation is as follows:
pma(float src, int length) =>
float PMA = 0., float SMA = 0., float Slope = 0.
float Sx = 0.0 , float Sy = 0.0
float Sxx = 0.0 , float Syy = 0.0 , float Sxy = 0.0
for count = 1 to length
float src1 = src
Sx += count
Sy += src
Sxx += count * count
Syy += src1 * src1
Sxy += count * src1
Slope := -(length * Sxy - Sx * Sy) / (length * Sxx - Sx * Sx)
SMA := Sy / length
PMA := SMA + Slope * length / 2
However, loops in Pine can be computationally expensive, and the above loop's runtime scales directly with the specified length. Fortunately, Pine's built-in functions often eliminate the need for loops. This indicator implements the following function, which simplifies the process by using the ta.linreg() and ta.sma() functions to calculate equivalent slope and SMA values efficiently:
pma(float src, int length) =>
float Slope = ta.linreg(src, length, 0) - ta.linreg(src, length, 1)
float SMA = ta.sma(src, length)
float PMA = SMA + Slope * length * 0.5
To learn more about loop elimination in Pine, refer to this section of the User Manual's Profiling and optimization page.

Smart Money Trade_masterСмарт мани более менее бесплатный вариант хорошо прорисовывает структуру. Поделился им со мной один из участников закрытой группы Александр.

Multi-Indicator Signals with Selectable Options by DiGetMulti-Indicator Signals with Selectable Options
Script Overview
This Pine Script is a multi-indicator trading strategy designed to generate buy/sell signals based on combinations of popular technical indicators: RSI (Relative Strength Index) , CCI (Commodity Channel Index) , and Stochastic Oscillator . The script allows you to select which combination of signals to display, making it highly customizable and adaptable to different trading styles.
The primary goal of this script is to provide clear and actionable entry/exit points by visualizing buy/sell signals with arrows , labels , and vertical lines directly on the chart. It also includes input validation, dynamic signal plotting, and clutter-free line management to ensure a clean and professional user experience.
Key Features
1. Customizable Signal Types
You can choose from five signal types:
RSI & CCI : Combines RSI and CCI signals for confirmation.
RSI & Stochastic : Combines RSI and Stochastic signals.
CCI & Stochastic : Combines CCI and Stochastic signals.
RSI & CCI & Stochastic : Requires all three indicators to align for a signal.
All Signals : Displays individual signals from each indicator separately.
This flexibility allows you to test and use the combination that works best for your trading strategy.
2. Clear Buy/Sell Indicators
Arrows : Buy signals are marked with upward arrows (green/lime/yellow) below the candles, while sell signals are marked with downward arrows (red/fuchsia/gray) above the candles.
Labels : Each signal is accompanied by a label ("BUY" or "SELL") near the arrow for clarity.
Vertical Lines : A vertical line is drawn at the exact bar where the signal occurs, extending from the low to the high of the candle. This ensures you can pinpoint the exact entry point without ambiguity.
3. Dynamic Overbought/Oversold Levels
You can customize the overbought and oversold levels for each indicator:
RSI: Default values are 70 (overbought) and 30 (oversold).
CCI: Default values are +100 (overbought) and -100 (oversold).
Stochastic: Default values are 80 (overbought) and 20 (oversold).
These levels can be adjusted to suit your trading preferences or market conditions.
4. Input Validation
The script includes built-in validation to ensure that oversold levels are always lower than overbought levels for each indicator. If the inputs are invalid, an error message will appear, preventing incorrect configurations.
5. Clean Chart Design
To avoid clutter, the script dynamically manages vertical lines:
Only the most recent 50 buy/sell lines are displayed. Older lines are automatically deleted to keep the chart clean.
Labels and arrows are placed strategically to avoid overlapping with candles.
6. ATR-Based Offset
The vertical lines and labels are offset using the Average True Range (ATR) to ensure they don’t overlap with the price action. This makes the signals easier to see, especially during volatile market conditions.
7. Scalable and Professional
The script uses arrays to manage multiple vertical lines, ensuring scalability and performance even when many signals are generated.
It adheres to Pine Script v6 standards, ensuring compatibility and reliability.
How It Works
Indicator Calculations :
The script calculates the values of RSI, CCI, and Stochastic Oscillator based on user-defined lengths and smoothing parameters.
It then checks for crossover/crossunder conditions relative to the overbought/oversold levels to generate individual signals.
Combined Signals :
Depending on the selected signal type, the script combines the individual signals logically:
For example, a "RSI & CCI" buy signal requires both RSI and CCI to cross into their respective oversold zones simultaneously.
Signal Plotting :
When a signal is generated, the script:
Plots an arrow (upward for buy, downward for sell) at the corresponding bar.
Adds a label ("BUY" or "SELL") near the arrow for clarity.
Draws a vertical line extending from the low to the high of the candle to mark the exact entry point.
Line Management :
To prevent clutter, the script stores up to 50 vertical lines in arrays (buy_lines and sell_lines). Older lines are automatically deleted when the limit is exceeded.
Why Use This Script?
Versatility : Whether you're a scalper, swing trader, or long-term investor, this script can be tailored to your needs by selecting the appropriate signal type and adjusting the indicator parameters.
Clarity : The combination of arrows, labels, and vertical lines ensures that signals are easy to spot and interpret, even in fast-moving markets.
Customization : With adjustable overbought/oversold levels and multiple signal options, you can fine-tune the script to match your trading strategy.
Professional Design : The script avoids clutter by limiting the number of lines displayed and using ATR-based offsets for better visibility.
How to Use This Script
Add the Script to Your Chart :
Copy and paste the script into the Pine Editor in TradingView.
Save and add it to your chart.
Select Signal Type :
Use the "Signal Type" dropdown menu to choose the combination of indicators you want to use.
Adjust Parameters :
Customize the lengths of RSI, CCI, and Stochastic, as well as their overbought/oversold levels, to match your trading preferences.
Interpret Signals :
Look for green arrows and "BUY" labels for buy signals, and red arrows and "SELL" labels for sell signals.
Vertical lines will help you identify the exact bar where the signal occurred.
Tips for Traders
Backtest Thoroughly : Before using this script in live trading, backtest it on historical data to ensure it aligns with your strategy.
Combine with Other Tools : While this script provides reliable signals, consider combining it with other tools like support/resistance levels or volume analysis for additional confirmation.
Avoid Overloading the Chart : If you notice too many signals, try tightening the overbought/oversold levels or switching to a combined signal type (e.g., "RSI & CCI & Stochastic") for fewer but higher-confidence signals.

Dynamic 2025this indicator is use for all members .
this indicator for use scalping.
this indicator for use interaday.
this indicator for use Swing Trading.
this indicator for use investment.
join for more profitable indicator please join me in teligram group
@profitnifty50

AO/AC Trading Zones Strategy [Skyrexio] Overview
AO/AC Trading Zones Strategy leverages the combination of Awesome Oscillator (AO), Acceleration/Deceleration Indicator (AC), Williams Fractals, Williams Alligator and Exponential Moving Average (EMA) to obtain the high probability long setups. Moreover, strategy uses multi trades system, adding funds to long position if it considered that current trend has likely became stronger. Combination of AO and AC is used for creating so-called trading zones to create the signals, while Alligator and Fractal are used in conjunction as an approximation of short-term trend to filter them. At the same time EMA (default EMA's period = 100) is used as high probability long-term trend filter to open long trades only if it considers current price action as an uptrend. More information in "Methodology" and "Justification of Methodology" paragraphs. The strategy opens only long trades.
Unique Features
No fixed stop-loss and take profit: Instead of fixed stop-loss level strategy utilizes technical condition obtained by Fractals and Alligator to identify when current uptrend is likely to be over. In some special cases strategy uses AO and AC combination to trail profit (more information in "Methodology" and "Justification of Methodology" paragraphs)
Configurable Trading Periods: Users can tailor the strategy to specific market windows, adapting to different market conditions.
Multilayer trades opening system: strategy uses only 10% of capital in every trade and open up to 5 trades at the same time if script consider current trend as strong one.
Short and long term trend trade filters: strategy uses EMA as high probability long-term trend filter and Alligator and Fractal combination as a short-term one.
Methodology
The strategy opens long trade when the following price met the conditions:
1. Price closed above EMA (by default, period = 100). Crossover is not obligatory.
2. Combination of Alligator and Williams Fractals shall consider current trend as an upward (all details in "Justification of Methodology" paragraph)
3. Both AC and AO shall print two consecutive increasing values. At the price candle close which corresponds to this condition algorithm opens the first long trade with 10% of capital.
4. If combination of Alligator and Williams Fractals shall consider current trend has been changed from up to downtrend, all long trades will be closed, no matter how many trades has been opened.
5. If AO and AC both continue printing the rising values strategy opens the long trade on each candle close with 10% of capital while number of opened trades reaches 5.
6. If AO and AC both has printed 5 rising values in a row algorithm close all trades if candle's low below the low of the 5-th candle with rising AO and AC values in a row.
Script also has additional visuals. If second long trade has been opened simultaneously the Alligator's teeth line is plotted with the green color. Also for every trade in a row from 2 to 5 the label "Buy More" is also plotted just below the teeth line. With every next simultaneously opened trade the green color of the space between teeth and price became less transparent.
Strategy settings
In the inputs window user can setup strategy setting:
EMA Length (by default = 100, period of EMA, used for long-term trend filtering EMA calculation).
User can choose the optimal parameters during backtesting on certain price chart.
Justification of Methodology
Let's explore the key concepts of this strategy and understand how they work together. We'll begin with the simplest: the EMA.
The Exponential Moving Average (EMA) is a type of moving average that assigns greater weight to recent price data, making it more responsive to current market changes compared to the Simple Moving Average (SMA). This tool is widely used in technical analysis to identify trends and generate buy or sell signals. The EMA is calculated as follows:
1.Calculate the Smoothing Multiplier:
Multiplier = 2 / (n + 1), Where n is the number of periods.
2. EMA Calculation
EMA = (Current Price) × Multiplier + (Previous EMA) × (1 − Multiplier)
In this strategy, the EMA acts as a long-term trend filter. For instance, long trades are considered only when the price closes above the EMA (default: 100-period). This increases the likelihood of entering trades aligned with the prevailing trend.
Next, let’s discuss the short-term trend filter, which combines the Williams Alligator and Williams Fractals. Williams Alligator
Developed by Bill Williams, the Alligator is a technical indicator that identifies trends and potential market reversals. It consists of three smoothed moving averages:
Jaw (Blue Line): The slowest of the three, based on a 13-period smoothed moving average shifted 8 bars ahead.
Teeth (Red Line): The medium-speed line, derived from an 8-period smoothed moving average shifted 5 bars forward.
Lips (Green Line): The fastest line, calculated using a 5-period smoothed moving average shifted 3 bars forward.
When the lines diverge and align in order, the "Alligator" is "awake," signaling a strong trend. When the lines overlap or intertwine, the "Alligator" is "asleep," indicating a range-bound or sideways market. This indicator helps traders determine when to enter or avoid trades.
Fractals, another tool by Bill Williams, help identify potential reversal points on a price chart. A fractal forms over at least five consecutive bars, with the middle bar showing either:
Up Fractal: Occurs when the middle bar has a higher high than the two preceding and two following bars, suggesting a potential downward reversal.
Down Fractal: Happens when the middle bar shows a lower low than the surrounding two bars, hinting at a possible upward reversal.
Traders often use fractals alongside other indicators to confirm trends or reversals, enhancing decision-making accuracy.
How do these tools work together in this strategy? Let’s consider an example of an uptrend.
When the price breaks above an up fractal, it signals a potential bullish trend. This occurs because the up fractal represents a shift in market behavior, where a temporary high was formed due to selling pressure. If the price revisits this level and breaks through, it suggests the market sentiment has turned bullish.
The breakout must occur above the Alligator’s teeth line to confirm the trend. A breakout below the teeth is considered invalid, and the downtrend might still persist. Conversely, in a downtrend, the same logic applies with down fractals.
In this strategy if the most recent up fractal breakout occurs above the Alligator's teeth and follows the last down fractal breakout below the teeth, the algorithm identifies an uptrend. Long trades can be opened during this phase if a signal aligns. If the price breaks a down fractal below the teeth line during an uptrend, the strategy assumes the uptrend has ended and closes all open long trades.
By combining the EMA as a long-term trend filter with the Alligator and fractals as short-term filters, this approach increases the likelihood of opening profitable trades while staying aligned with market dynamics.
Now let's talk about the trading zones concept and its signals. To understand this we need to briefly introduce what is AO and AC. The Awesome Oscillator (AO), developed by Bill Williams, is a momentum indicator designed to measure market momentum by contrasting recent price movements with a longer-term historical perspective. It helps traders detect potential trend reversals and assess the strength of ongoing trends.
The formula for AO is as follows:
AO = SMA5(Median Price) − SMA34(Median Price)
where:
Median Price = (High + Low) / 2
SMA5 = 5-period Simple Moving Average of the Median Price
SMA 34 = 34-period Simple Moving Average of the Median Price
The Acceleration/Deceleration (AC) Indicator, introduced by Bill Williams, measures the rate of change in market momentum. It highlights shifts in the driving force of price movements and helps traders spot early signs of trend changes. The AC Indicator is particularly useful for identifying whether the current momentum is accelerating or decelerating, which can indicate potential reversals or continuations. For AC calculation we shall use the AO calculated above is the following formula:
AC = AO − SMA5(AO) , where SMA5(AO)is the 5-period Simple Moving Average of the Awesome Oscillator
When the AC is above the zero line and rising, it suggests accelerating upward momentum.
When the AC is below the zero line and falling, it indicates accelerating downward momentum.
When the AC is below zero line and rising it suggests the decelerating the downtrend momentum. When AC is above the zero line and falling, it suggests the decelerating the uptrend momentum.
Now let's discuss the trading zones concept and how it can create the signal. Zones are created by the combination of AO and AC. We can divide three zone types:
Greed zone: when the AO and AC both are rising
Red zone: when the AO and AC both are decreasing
Gray zone: when one of AO or AC is rising, the other is falling
Gray zone is considered as uncertainty. AC and AO are moving in the opposite direction. Strategy skip such price action to decrease the chance to stuck in the losing trade during potential sideways. Red zone is also not interesting for the algorithm because both indicators consider the trend as bearish, but strategy opens only long trades. It is waiting for the green zone to increase the chance to open trade in the direction of the potential uptrend. When we have 2 candles in a row in the green zone script executes a long trade with 10% of capital.
Two green zone candles in a row is considered by algorithm as a bullish trend, but now so strong, that's the reason why trade is going to be closed when the combination of Alligator and Fractals will consider the the trend change from bullish to bearish. If id did not happens, algorithm starts to count the green zone candles in a row. When we have 5 in a row script change the trade closing condition. Such situation is considered is a high probability strong bull market and all trades will be closed if candle's low will be lower than fifth green zone candle's low. This is used to increase probability to secure the profit. If long trades are initiated, the strategy continues utilizing subsequent signals until the total number of trades reaches a maximum of 5. Each trade uses 10% of capital.
Why we use trading zones signals? If currently strategy algorithm considers the high probability of the short-term uptrend with the Alligator and Fractals combination pointed out above and the long-term trend is also suggested by the EMA filter as bullish. Rising AC and AO values in the direction of the most likely main trend signaling that we have the high probability of the fastest bullish phase on the market. The main idea is to take part in such rapid moves and add trades if this move continues its acceleration according to indicators.
Backtest Results
Operating window: Date range of backtests is 2023.01.01 - 2024.12.31. It is chosen to let the strategy to close all opened positions.
Commission and Slippage: Includes a standard Binance commission of 0.1% and accounts for possible slippage over 5 ticks.
Initial capital: 10000 USDT
Percent of capital used in every trade: 10%
Maximum Single Position Loss: -9.49%
Maximum Single Profit: +24.33%
Net Profit: +4374.70 USDT (+43.75%)
Total Trades: 278 (39.57% win rate)
Profit Factor: 2.203
Maximum Accumulated Loss: 668.16 USDT (-5.43%)
Average Profit per Trade: 15.74 USDT (+1.37%)
Average Trade Duration: 60 hours
How to Use
Add the script to favorites for easy access.
Apply to the desired timeframe and chart (optimal performance observed on 4h BTC/USDT).
Configure settings using the dropdown choice list in the built-in menu.
Set up alerts to automate strategy positions through web hook with the text: {{strategy.order.alert_message}}
Disclaimer:
Educational and informational tool reflecting Skyrex commitment to informed trading. Past performance does not guarantee future results. Test strategies in a simulated environment before live implementation
These results are obtained with realistic parameters representing trading conditions observed at major exchanges such as Binance and with realistic trading portfolio usage parameters.

RSI & Heikin Ashi Alerts PEGOFEThis RSI & Heikin-Ashi Alerts Indicator helps traders identify potential buy and sell opportunities based on RSI levels and Heikin-Ashi candle confirmation. It is designed to generate signals when:
✅ RSI reaches overbought (≥70) or oversold (≤30) levels.
✅ Two consecutive Heikin-Ashi candles change color, confirming trend reversal.
✅ Buy signals (green marker) appear after RSI is oversold, followed by two bullish Heikin-Ashi candles.
✅ Sell signals (red marker) appear after RSI is overbought, followed by two bearish Heikin-Ashi candles.
✅ Alerts can be set to notify traders when conditions are met.
🚀 Perfect for traders looking for RSI-based trend reversals with Heikin-Ashi confirmation!
Este Indicador de Alertas RSI & Heikin-Ashi ayuda a los traders a identificar posibles oportunidades de compra y venta basadas en niveles de RSI y confirmación de velas Heikin-Ashi. Genera señales cuando:
✅ El RSI alcanza niveles de sobrecompra (≥70) o sobreventa (≤30).
✅ Dos velas Heikin-Ashi consecutivas cambian de color, confirmando un posible cambio de tendencia.
✅ Las señales de compra (marcador verde) aparecen cuando el RSI está en sobreventa y dos velas Heikin-Ashi alcistas confirman el giro.
✅ Las señales de venta (marcador rojo) aparecen cuando el RSI está en sobrecompra y dos velas Heikin-Ashi bajistas confirman el giro.
✅ Se pueden configurar alertas para recibir notificaciones cuando se cumplan las condiciones.
🚀 ¡Ideal para traders que buscan reversiones de tendencia basadas en RSI con confirmación de Heikin-Ashi!

IU Imbalance Trend StrategyIU Imbalance Trend Strategy
The IU Imbalance Trend Strategy is a trend-following strategy that combines order flow imbalance, trend filtering, and RSI-based momentum confirmation to generate long and short trading signals.
User Inputs:
- Imbalance Length (Default: 10) – Defines the lookback period for calculating order flow imbalance.
- Trend Length (Default: 50) – Determines the moving average period for identifying bullish and bearish trends.
- RSI Length (Default: 14) – Sets the period for the Relative Strength Index (RSI) calculation.
How It Works:
1. Order Flow Score: The strategy calculates an imbalance score based on the highest and lowest close prices over a set period, helping to identify potential shifts in market direction.
2. Trend Filter: A dynamic trend filter is applied using a moving average and ATR to detect bullish and bearish market conditions.
3. RSI Confirmation: A momentum filter using RSI ensures trades are taken only when momentum supports the trend.
Long Entry Conditions:
- Order Flow Score is positive (indicating bullish imbalance).
- Price is above the Bull Trend Line (uptrend confirmation).
- RSI is above 50 (momentum supports buying).
- No active long trade (prevents duplicate entries).
Short Entry Conditions:
- Order Flow Score is negative (indicating bearish imbalance).
- Price is below the Bear Trend Line (downtrend confirmation).
- RSI is below 50 (momentum supports selling).
- No active short trade (prevents duplicate entries).
Additional Features:
- Trend Bands: Visual representation of bullish and bearish trend zones.
- Entry Signals: Green and red labels indicate long and short trade opportunities.
- Alerts: Get notified when a long or short entry is triggered.

False Breakouts With Impulse [PhilDotC]New to TV and Pine Script and also reading Dr Alexander Elder's The New Trading for a Living.
I have rolled two ideas from the book into one indicator and made it usable in the Pine Screener. When using in the screener tick the "Screener mode" property to get an additional query option allowing you to filter by the number of days since the last false bottom.
This is version 1 of the indicator script and only supports false bottoms (I can only trade long with my broker)
To cut down the amount of clutter on my screen I have rolled the Elder Impulse bar colouring into the indicator. Thanks to @LazyBear for that code.
Use it if it helps, suggestions for improvements to the code great fully accepted.


ATR/CCI Adaptive Trend BandsATR/CCI Trend Bands is a dynamic trend-following indicator that combines the power of the Average True Range (ATR) and Commodity Channel Index (CCI) to create adaptive support and resistance bands. The indicator plots upper and lower trend bands based on ATR deviations while using CCI to confirm trend direction. The bands visually highlight areas of trend strength and potential reversals, helping traders identify key price zones."
🔹 Key Features:
✅ ATR-Based Trend Bands – Dynamically adjust to market volatility.
✅ CCI Confirmation – Determines whether price is in an uptrend or downtrend.
✅ Color-Coded Trendline – Blue for bullish trends, red for bearish trends.
✅ Shaded Support & Resistance Zones – Red upper bands (resistance), blue lower bands (support).
✅ Customizable Parameters – ATR length, multipliers, and CCI period can be adjusted.
🔹 How to Use:
Trend Trading: Follow the bands to ride trends with confidence.
Breakout Confirmation: Watch for price breaking above/below the bands for potential strong moves.
Reversal Trading: Use the shaded zones as dynamic support and resistance levels.
This indicator is suitable for all timeframes and markets and is designed to be a versatile tool for both trend-followers and breakout traders. 🚀📈

FVG Reversal SentinelFVG Reversal Sentinel
A Fair Value Gap (FVG) is an area on a price chart where there is a gap between candles. It indicates an imbalance in the market due to rapid price movement. It represents untraded price levels caused by strong buying or selling pressure.
FVGs are crucial in price action trading as they highlight the difference between the current market price of an asset and its fair value. Traders use these gaps to identify potential trading opportunities, as they often indicate areas where the market may correct itself.
This indicator will overlap multiple timeframes FVGs over the current timeframe to help traders anticipate and plan their trades.
Features
Up to 5 different timeframes can be displayed on a chart
Hide the lower timeframes FVGs to get a clear view in a custom timeframe
Configurable colors for bullish and bearish FVGs
Configurable borders for the FVG boxes
Configurable labels for the different timeframes you use
Show or hide mitigated FVGs to declutter the chart
FVGs are going to be displayed only when the candle bar closes
FVGs are going to be mitigated only when the body of the candle closes above or below the FVG area
No repainting
Settings
TIMEFRAMES
This indicator provides the ability to select up to 5 timeframes. These timeframes are based on the trader's timeframes including any custom timeframes.
Select the desired timeframe from the options list
Add the label text you would like to show for the selected timeframe
Check or uncheck the box to display or hide the timeframe from your chart
FVG SETTINGS
Control basic settings for the FVGs
Length of boxes: allows you to select the length of the box that is going to be displayed for the FVGs
Delete boxes after fill?: allows you to show or hide mitigated FVGs on your chart
Hide FVGs lower than enabled timeframes?: allows you to show or hide lower timeframe FVGs on your chart. Example - You are in a 15 minutes timeframe chart, if you choose to hide lower timeframe FVGs you will not be able to see 5 minutes FVG defined in your Timeframes Settings, only 15 minutes or higher timeframe FVGs will be displayed on your chart
BOX VISUALS
Allows you to configure the color and opacity of the bullish and bearish FVGs boxes.
Bullish FVG box color: the color and opacity of the box for the bullish FVGs
Bearish FVG box color: the color and opacity of the box for the bearish FVGs
LABELS VISUALS
Allows you to configure the style of the boxes labels
Bullish FVG labels color: the color for bullish labels
Bearish FVG labels color: the color for bearish labels
Labels size: the size of the text displayed in the labels
Labels position: the position of the label inside the FVGs boxes (right, left or center)
BORDER VISUALS
Allows you to configure the border style of the FVGs boxes
Border width: the width of the border (the thickness)
Bullish FVG border color: the color and the opacity of the bullish box border
Bearish FVG border color: the color and the opacity of the bearish box border
Once desired settings have been achieved, the settings can be saved as default from the bottom left of the indicator settings page for future use.

RSI with Hybrid HTFDESCRIPTION:
This script calculates a Hybrid RSI using a checkpoint system to store data only at new bars of a selected timeframe (HTF).
It allows accurate RSI computation inside the running HTF candle while maintaining precision.
I have used simple calculation defination RSI from built-in and also RMA. I have applied a checkpoint system to reset values based on the selected timeframe
NOTES:
This script calculates RSI using a hybrid system that correctly processes higher timeframe RSI values within the running candle.
The script is non-repainting, transparent, and allows accurate real-time RSI calculations.
This study is for educational purposes only and should not be considered financial advice.

Volumatic Variable Index Dynamic Average [Kuuumz]This is basically the indicator from BigBeluga but added ability to configure the length of the pivot line.

No gaps candles with 50 EMAraaaaaaaaaaaand djvhdsifhakujrfidffwofxi fhqwj3riugewrioriqeouirh efkudhcrj r;ofbsu 3wli gq3ogihae 3krigaw ilurgfhe;o 34krjgkugr iuhgiurerioutrhiog uyg rsiugt q34iu w


Power Law Below is a detailed, line-by-line explanation in English of the Pine Script (TradingView) code. It uses Pine Script v6 syntax.
---
```pine
//@version=6
indicator("Power Law", overlay=true)
```
1. `//@version=6`
- Declares that this script uses Pine Script version 6. It must appear on the very first line.
2. `indicator("Power Law", overlay=true)`
- Defines this script as an indicator named **"Power Law"**.
- `overlay=true` means this indicator is plotted on the main chart (the price chart) rather than in a separate pane.
---
```pine
// Days X-Axis Value
start = time == timestamp(2010, 7, 18, 0, 0)
days = request.security("INDEX:BTCUSD", 'D', ta.barssince(start))
offset = 561 // days between 2009/1/1 and "start"
d = days + offset
```
1. `start = time == timestamp(2010, 7, 18, 0, 0)`
- Checks if the current bar’s `time` equals July 18, 2010 at 00:00. This returns a boolean value (`true` or `false`).
- It’s mainly used together with `ta.barssince(start)` to calculate the number of bars elapsed since this “start” date.
2. `days = request.security("INDEX:BTCUSD", 'D', ta.barssince(start))`
- `request.security()` lets the script request data from another symbol or another timeframe—in this case, `"INDEX:BTCUSD"` on the Daily (`'D'`) timeframe.
- The third argument, `ta.barssince(start)`, is a built-in function in Pine that counts how many bars have passed since `start` was `true`. In this script, it effectively measures how many daily bars have elapsed since July 18, 2010.
- The result is assigned to `days`, indicating “the count of daily bars between July 18, 2010 and the most recent daily bar in the BTC index.”
3. `offset = 561`
- A user-defined number. The comment states it’s the number of days between January 1, 2009, and the “start” date (July 18, 2010). It is used to calibrate or shift the day count.
4. `d = days + offset`
- Adds the offset to `days`, giving a final day-count-like value (`d`) that the script uses later in the power-law calculations.
---
```pine
a = input(-17.668, "Power Law Intercept", group="Power Law Settings")
b = input(5.926, "Power Law Slope", group="Power Law Settings")
```
- These lines define two adjustable parameters `a` and `b` using `input()`, making them editable via the indicator’s settings.
- `a` (the intercept) is labeled “Power Law Intercept.”
- `b` (the slope) is labeled “Power Law Slope.”
- `group="Power Law Settings"` puts them into a named group in the settings dialog.
---
```pine
price_power_law_0 = math.pow(10, a + b*math.log10(d))
price_power_law_1 = math.pow(10, a + b*math.log10(d + 1*365))
price_power_law_2 = math.pow(10, a + b*math.log10(d + 2*365))
price_power_law_3 = math.pow(10, a + b*math.log10(d + 3*365))
price_power_law_4 = math.pow(10, a + b*math.log10(d + 4*365))
price_power_law_5 = math.pow(10, a + b*math.log10(d + 5*365))
```
- These lines each calculate a “power law” price value:
\
- `d` is the base day count.
- `math.log10(...)` takes the base-10 logarithm.
- `a` is the intercept; `b` is the slope in the power-law model.
- Adding `(1*365), (2*365), ...` to `d` suggests forecasts or curves 1 year, 2 years, etc. beyond the baseline.
- `math.pow(10, ... )` is simply 10 raised to the power of `(a + b * log10(...))`.
---
```pine
// Use a valid 6-digit color code (e.g. #FFFFAA) or 8-digit (e.g. #FFFFAA80)
p0 = plot(price_power_law_0, color=#FFFFAA, title="Power Law", linewidth=1)
p1 = plot(price_power_law_1, title="Power Law 1", linewidth=1, color=bar_index % 2 == 0 ? #FFFFAA : #000000)
p2 = plot(price_power_law_2, title="Power Law 2", linewidth=1, color=bar_index % 2 == 0 ? #FFFFAA : #000000)
p3 = plot(price_power_law_3, title="Power Law 3", linewidth=1, color=bar_index % 2 == 0 ? #FFFFAA : #000000)
p4 = plot(price_power_law_4, title="Power Law 4", linewidth=1, color=bar_index % 2 == 0 ? #FFFFAA : #000000)
p5 = plot(price_power_law_5, title="Power Law 5", linewidth=1, color=bar_index % 2 == 0 ? #FFFFAA : #000000)
```
1. The script plots six lines (from `price_power_law_0` to `price_power_law_5`).
2. `color=#FFFFAA`
- A 6-digit hex color (`#RRGGBB`) that sets the line’s color.
3. `color=bar_index % 2 == 0 ? #FFFFAA : #000000`
- A conditional color assignment: if `bar_index % 2 == 0`, the color is `#FFFFAA`, otherwise it is `#000000`. This makes line colors alternate depending on the bar index.
4. `linewidth=1` sets the thickness of each line.
5. `title="Power Law X"` sets each line’s label in the chart’s legend.
---
## How It Works
- The script calculates how many daily bars have passed since July 18, 2010 (plus a manual offset of 561 days).
- It then applies a power-law formula for various offsets (`+ 1*365`, etc.), each representing a different curve.
- Finally, it plots these six curves on the main chart, showing potential price trajectories or “power-law” relationships for Bitcoin’s historical data (taken from `"INDEX:BTCUSD"` on a daily timeframe).
## Important Notes
1. **Color Codes**
- Must be valid 6-digit or 8-digit hex codes (e.g. `#FFFFAA` or `#FFFFAA80`). Otherwise, you’ll get a syntax error.
2. **`request.security()`**
- Fetching data from `"INDEX:BTCUSD"` on a daily timeframe. If your chart is on another symbol or timeframe, the script still references the daily bars from that index, which can lead to alignment differences.
3. **Logarithms**
- Make sure `d` (or `d + n*365`) never becomes zero or negative, otherwise `math.log10()` will fail. If your script tries to log10(0) or a negative number, you’ll get an error.
4. **Conceptual Use**
- This script’s logic is specific to modeling Bitcoin’s price over time using a power-law approach. You can change the `start` date, the offset, or the intercept/slope inputs to adapt the script for different data sources or fitting strategies.
---
**In summary,** this script draws several power-law curves on the chart based on a reference date (July 18, 2010) and an offset, presumably chosen to align with Bitcoin’s historical timeline. By adjusting `a` (the intercept) and `b` (the slope), you can fine-tune how these curves fit the historical data.


ORB by VJRange Breakout Indicator (RBI) – High-Probability Trading Tool
The Range Breakout Indicator (RBI) is a powerful trading tool designed to identify high-probability breakout opportunities with a winning accuracy of over 90%. This indicator analyzes price consolidation zones, detects key breakout levels, and confirms momentum shifts to maximize profitability.
Key Features:
✅ Breakout Confirmation: Detects valid breakouts beyond a defined range, reducing false signals.
✅ Smart Volatility Filter: Ensures breakouts occur with sufficient momentum for sustained price movement.
✅ Trend Bias Detection: Aligns breakouts with the prevailing trend for higher success rates.
✅ Risk Management Alerts: Provides optimal stop-loss and take-profit levels for secure trading.
✅ Multi-Timeframe Analysis: Enhances accuracy by filtering signals across different timeframes.
Ideal for intraday and swing traders, the RBI helps capitalize on market breakouts with exceptional accuracy, ensuring traders stay ahead of major price movements. 🚀📈

Smart Money Breakouts [kuuumz] to backtest chartprime settingsThis strategy is meant to help people backtest the smart money breakouts chartprime indicator to find the right settings that provide greatest rate of return.
